For colleges, universities, and independent schools
Stop paying for electricity peaks you can't see.
Intervalwise shows you exactly when your demand charges are being set, what's driving them, and what to change. Built for Pacific Northwest institutions.
From utility data to dollars saved.
Three steps. Most institutions complete setup in under 30 minutes.
Connect your utility
PG&E customers authorize via secure OAuth. Pacific Power, PSE, Avista, and Idaho Power customers upload interval data CSVs from their utility portal.
Intervalwise analyzes
Your 15-minute interval data is processed nightly. We identify the exact moments your peak demand was set, attribute it to specific buildings, and calculate the dollar impact.
You take action
Specific recommendations explain what to change — like staggering HVAC startup or deferring equipment to off-peak windows. Predictive alerts warn you before high-risk days.
Designed for facilities directors, not energy engineers.
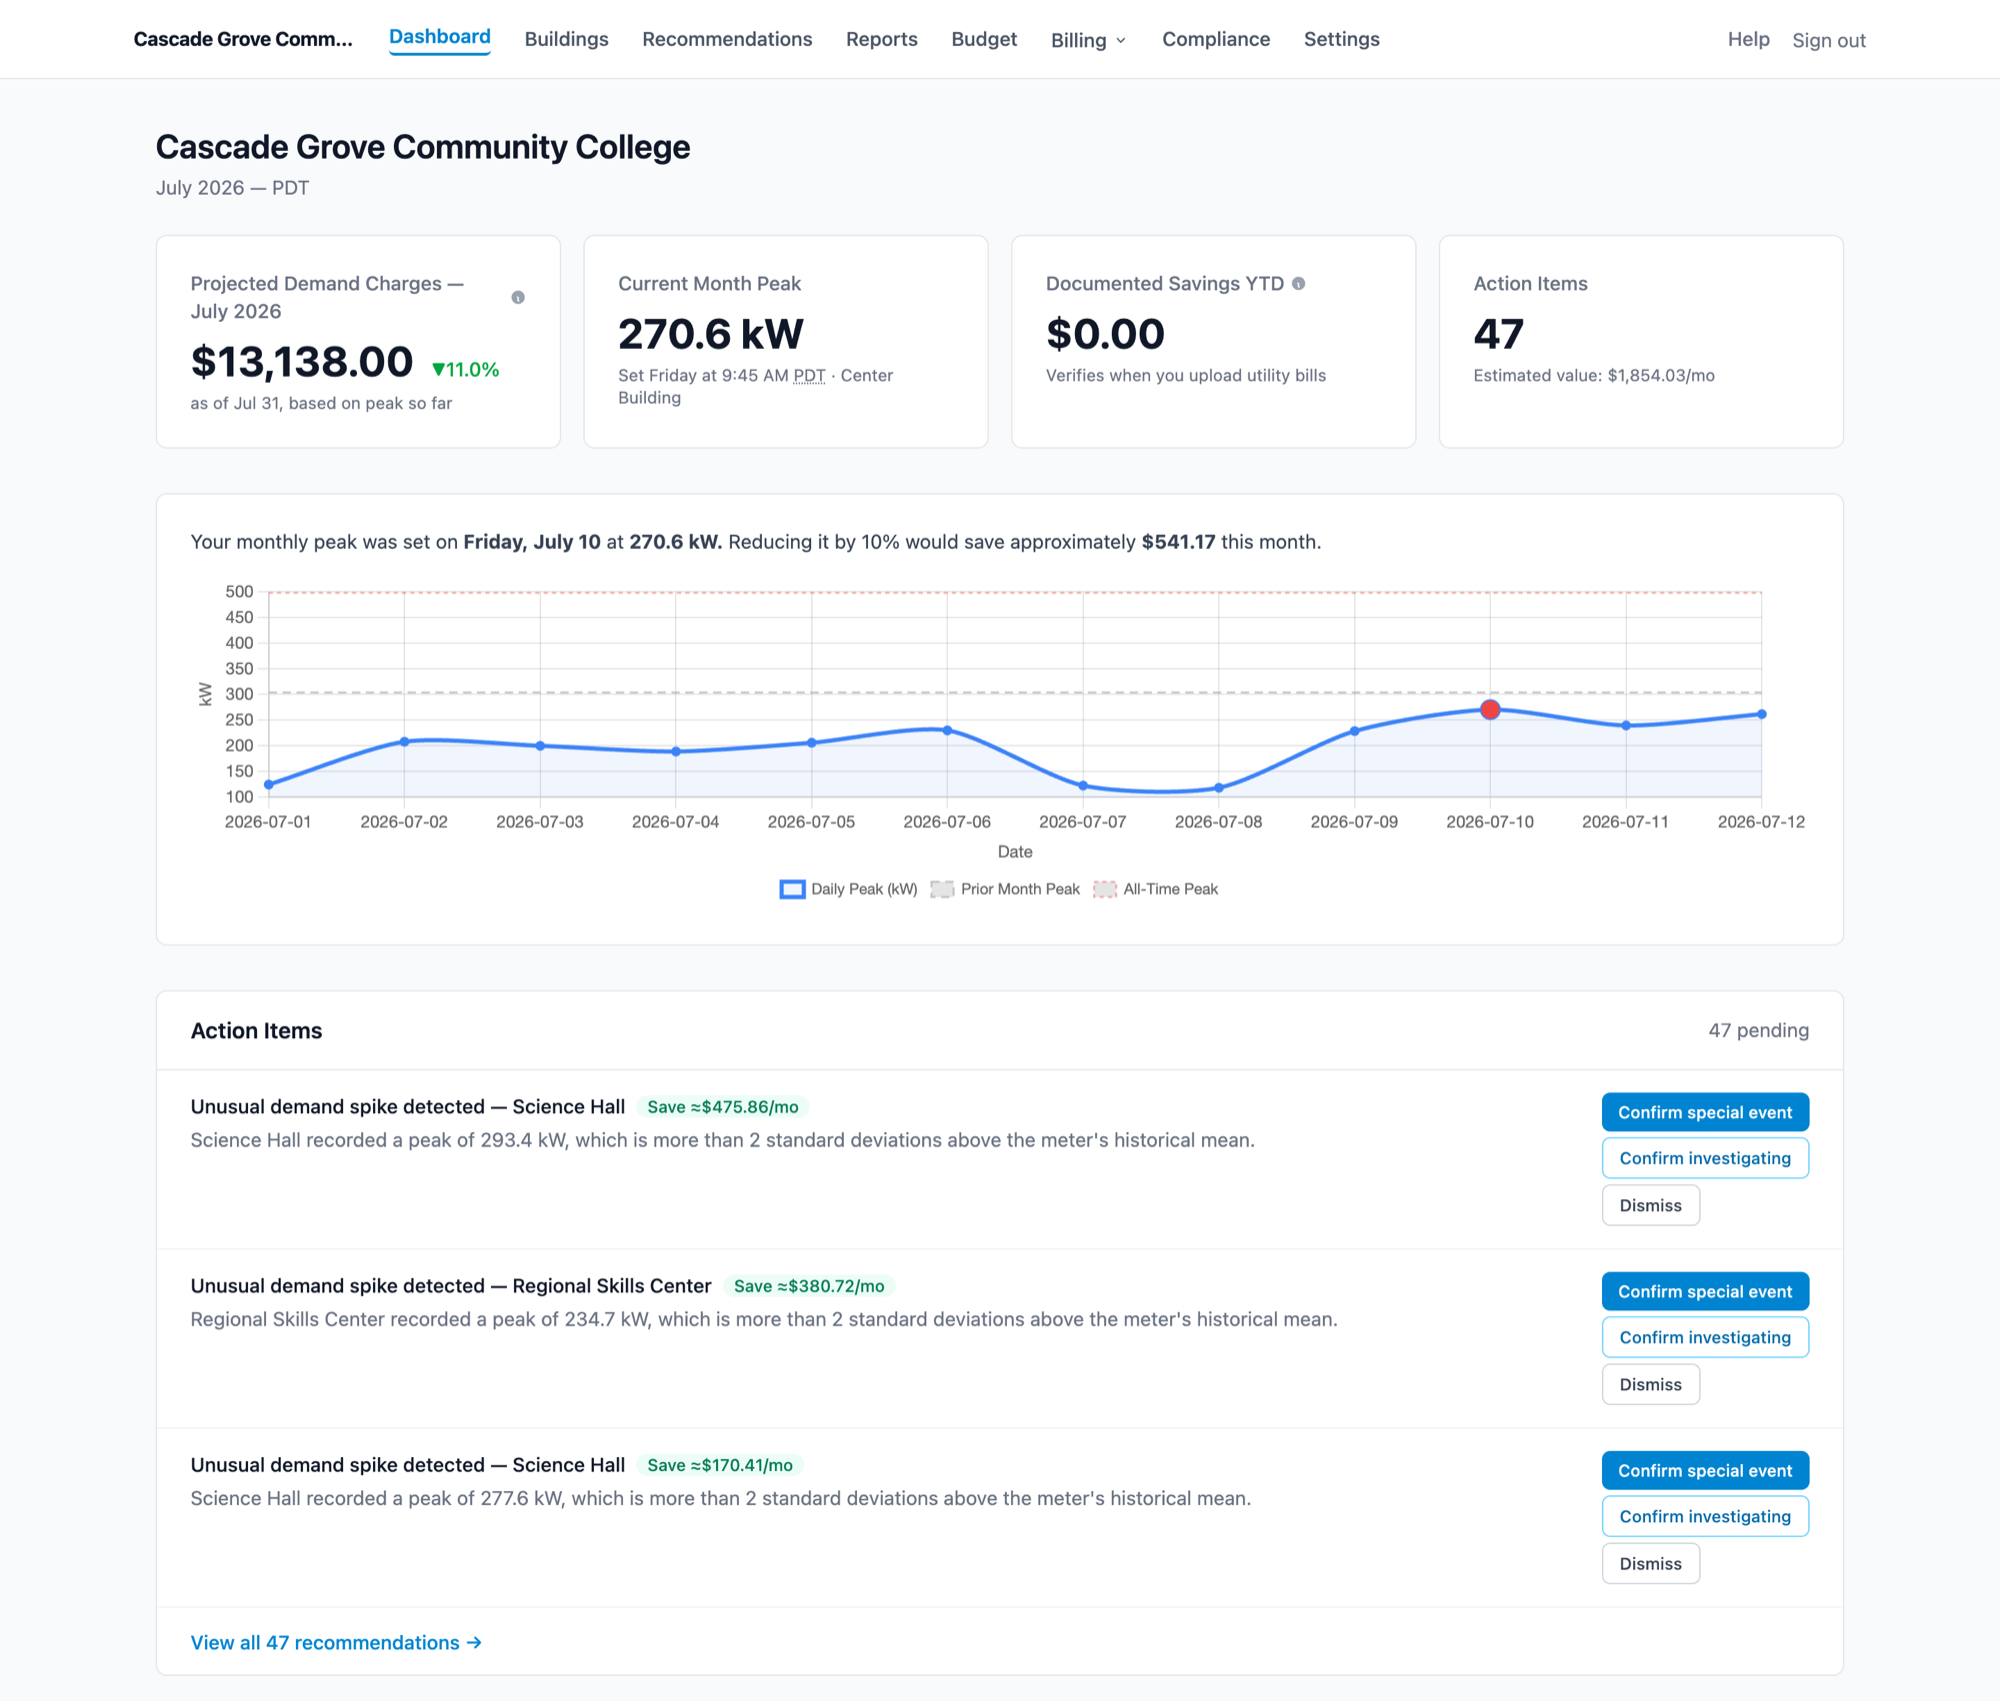
Demand dashboard
See your peak demand for the current billing period at a glance. Drill into individual buildings to find the loads driving your charges. Updates daily as new readings sync from your utility.
Predictive alerts
Get an email at 2 PM when forecasted demand threatens to set a new peak — with specific buildings, suggested actions, and the reasoning behind the prediction.
Monthly reports
PDF reports showing peak events, building breakdowns, weather-normalized comparisons, and the narrative behind each month's charges. Ready to share with your business office.
ENERGY STAR benchmarking export
One click produces upload-ready spreadsheets for Portfolio Manager — meet benchmarking mandates like the Washington Clean Buildings Act without retyping a single meter reading.
GHG reporting for sustainability offices
Monthly kWh and location-based Scope 2 emissions per campus, computed with EPA eGRID factors — the source document for your SIMAP and AASHE STARS submissions.
Simple pricing for institutions of every size.
All plans include unlimited users, full data history, and email support.
Start here
Pilot
$4,900
90 days
- Full product access for your whole campus
- Guided onboarding with your interval data
- 100% of the pilot fee credits toward your first year
Campus
$12,000
per year
Up to 8 buildings
- Demand dashboard
- Predictive alerts
- Monthly reports
- Email support
Most popular
Growth
$18,000
per year
Up to 25 buildings
- Everything in Campus
- Multi-campus support
- Demand response participation
- Priority support
District
$28,000
per year
Unlimited buildings
- Everything in Growth
- Custom report branding
- Dedicated onboarding
- Quarterly review calls
Demand charges are commonly 30–70% of an institutional electric bill. Every savings figure Intervalwise reports is confirmed against your actual utility bills — bill confirmation and measurement & verification (M&V) built in.
Colleges, universities, and independent schools joining our 2026 design partner program receive a discounted first year in exchange for reference participation and a published case study.
Inquire about design partner status →Ready to see what's setting your peak?
Request access and we'll follow up within one business day to schedule a 20-minute walkthrough of Intervalwise with your campus data.